When we publish CaseVBench results, one of the main numbers we report is called F1.
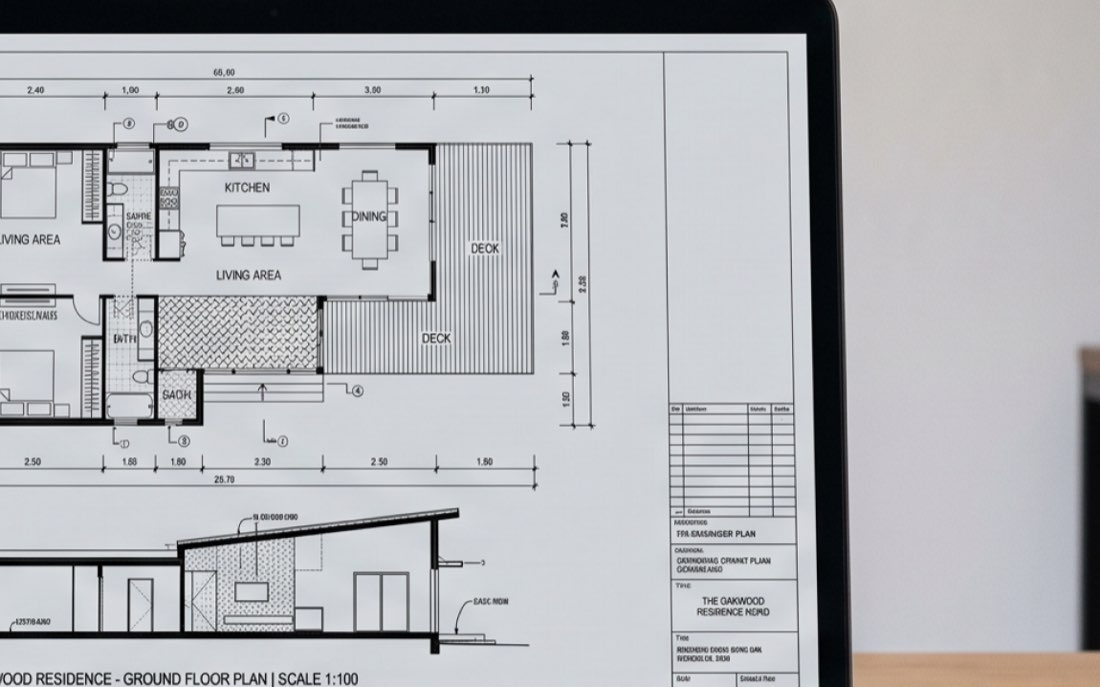
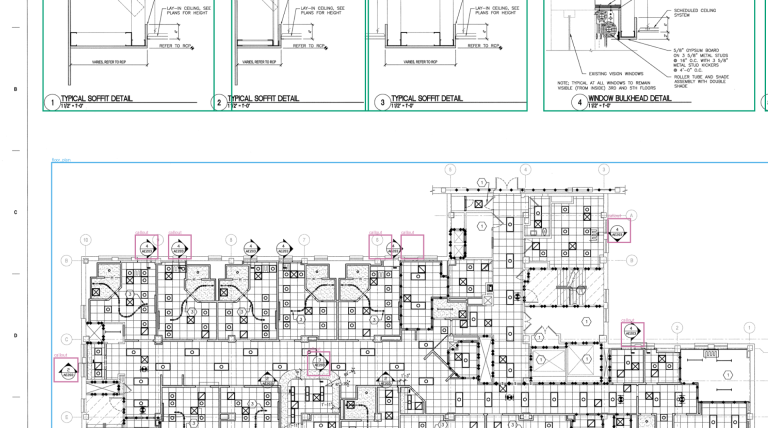
CaseVBench is a benchmark for measuring how accurately AI models can locate objects on architectural drawings, such as cabinets, countertops, floor plans, elevations and callouts.
What is F1?
F1 is a single score that combines two questions about a model’s output: how much of what it found was correct (precision), and how much of what exists it found (recall). It always lands closer to the weaker of the two, so a model can’t score well by being good at only one.
F1 is a standard metric in machine learning, but the name does not tell you much about what it measures.
Precision tells you how many of the model’s predictions are correct
Imagine you hand someone a kitchen drawing and ask them to circle every cabinet. There are 6 cabinets on the page.
They circle 5 things. When you check, 4 of those are cabinets. The fifth is a fridge they mistook for a cabinet.
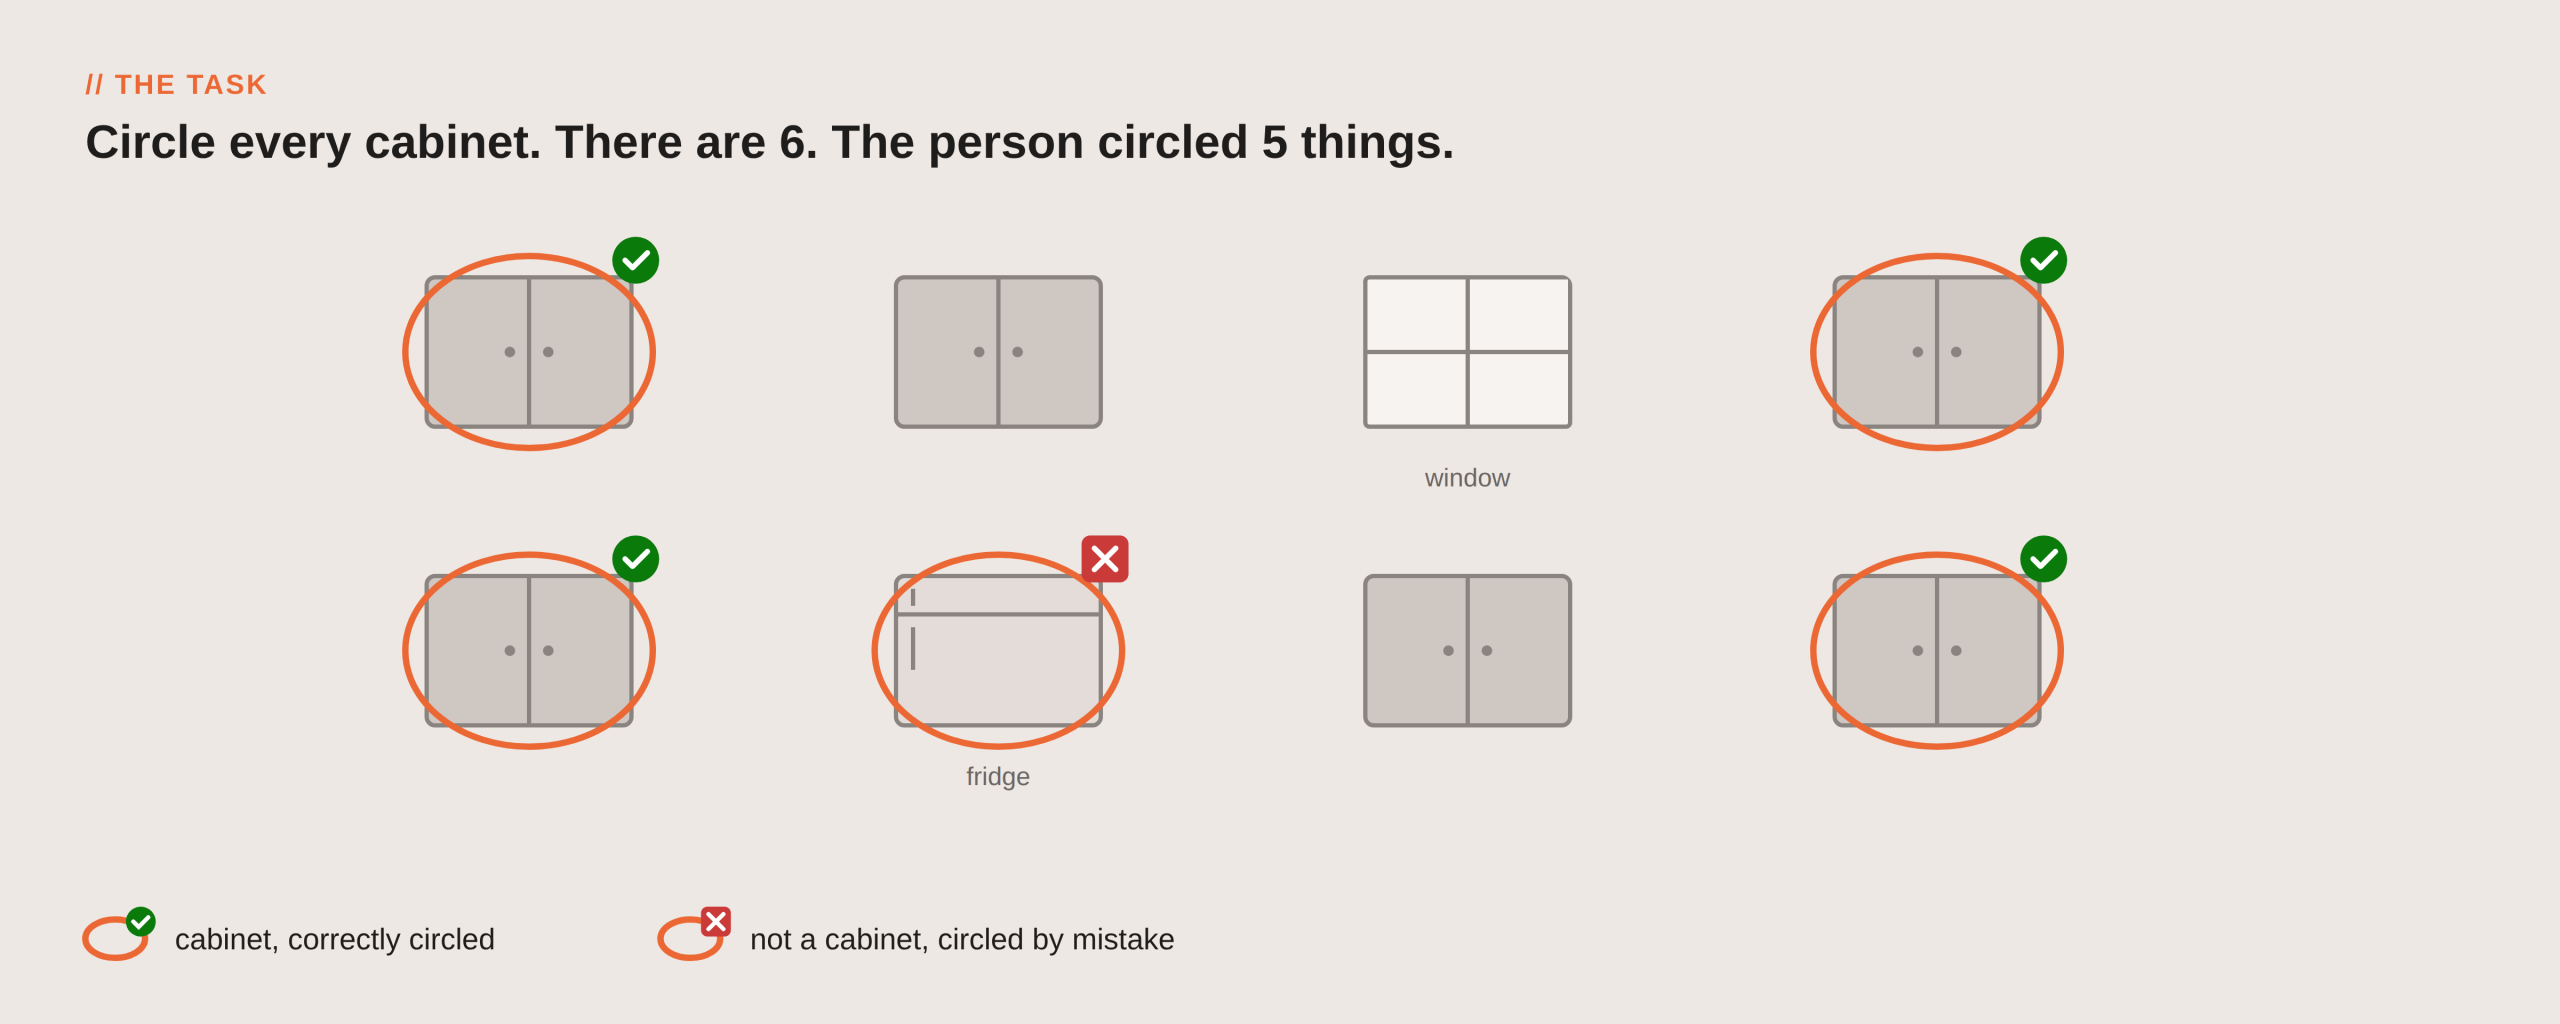
Of the 5 things they identified, 4 were correct. That gives a precision of 80%.
Recall tells you how many of the actual objects the model found
There are 6 cabinets on the drawing and the person found 4 of them. That gives a recall of 67%.
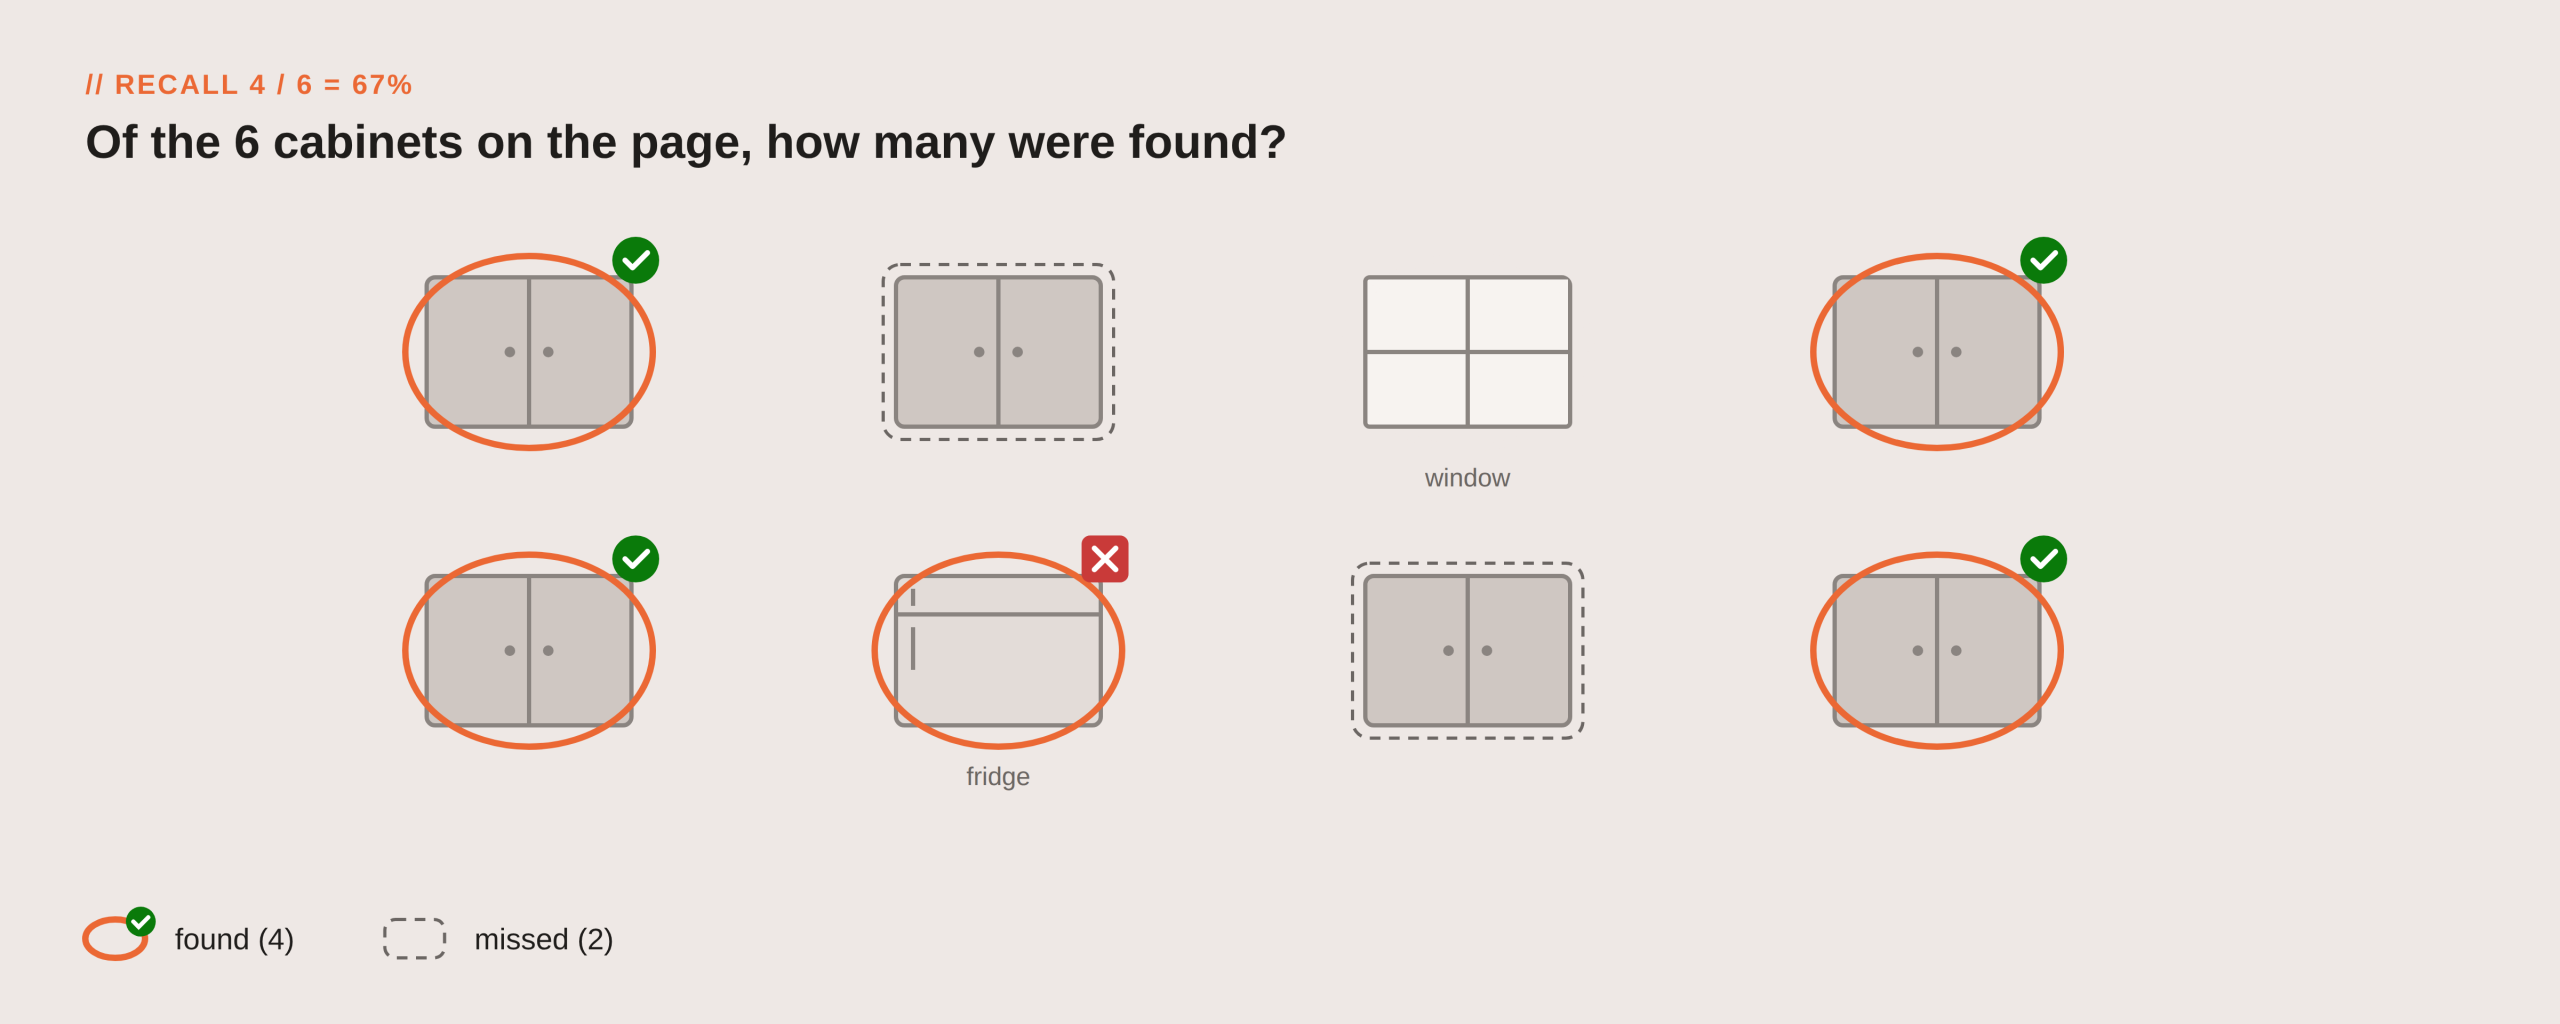
The two measurements describe different types of errors. Precision is affected by incorrect predictions. Recall is affected by objects that were missed.
F1 combines precision and recall so that both types of error affect the score
Each measurement can look good on its own.
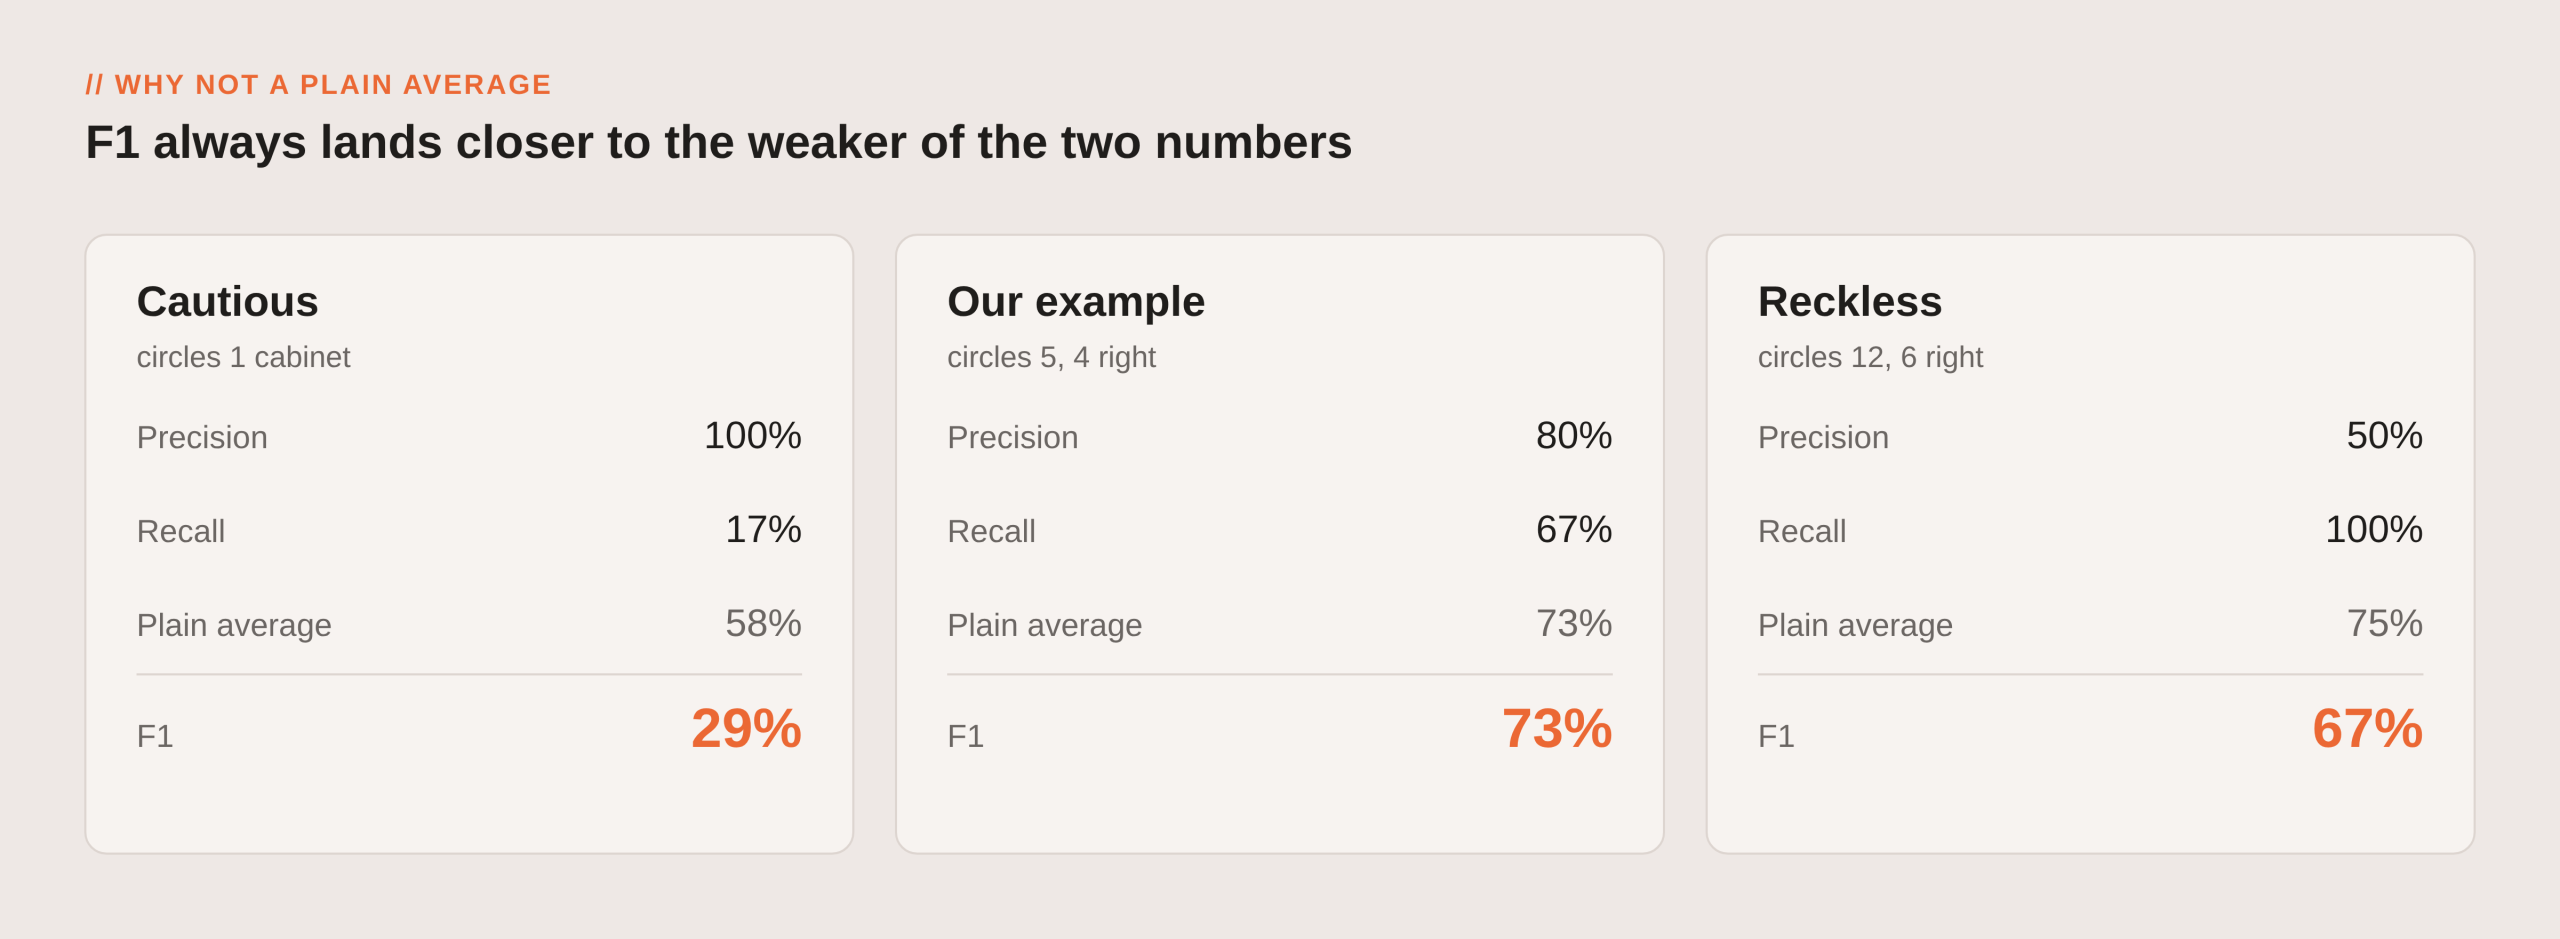
A cautious person might circle one cabinet they are completely sure about. Precision would be 100%, but recall would be only 17%.
Another person might circle everything that looks even slightly like a cabinet, say 12 things. All 6 cabinets are in there, so recall is 100%, but half of what they circled is wrong, so precision is 50%.
F1 combines precision and recall into one number, and it always lands closer to the weaker of the two. This is what stops a lopsided score from hiding behind a good one. For the person with 80% precision and 67% recall, F1 is approximately 73%, about the same as a plain average. For the person with 100% recall and 50% precision, it is 67%, where a plain average would give 75%.
The formula is F1 = 2 × (precision × recall) / (precision + recall).
The gap is widest when precision and recall are far apart. With 100% precision and 17% recall, for example, F1 is approximately 29%, rather than the 58% that a simple average would produce.
A 70% F1 doesn’t mean 70% of the drawing is correct
An F1 score of 70% does not mean that the model understands 70% of the drawing.
In CaseVBench, a model is asked to find specific objects and draw a rectangle around each one. That rectangle is called a bounding box. Each prediction is compared with a rectangle a person drew around the same object, and the two count as a match only if they overlap enough.
F1 measures detection performance under a specific evaluation method. It is not a general measure of how well an AI model understands an architectural drawing.
How close the box has to be to count
Finding the right cabinet is only half of a match. The model also has to draw its box in roughly the right place. The rule for “roughly” is called IoU.
What is IoU?
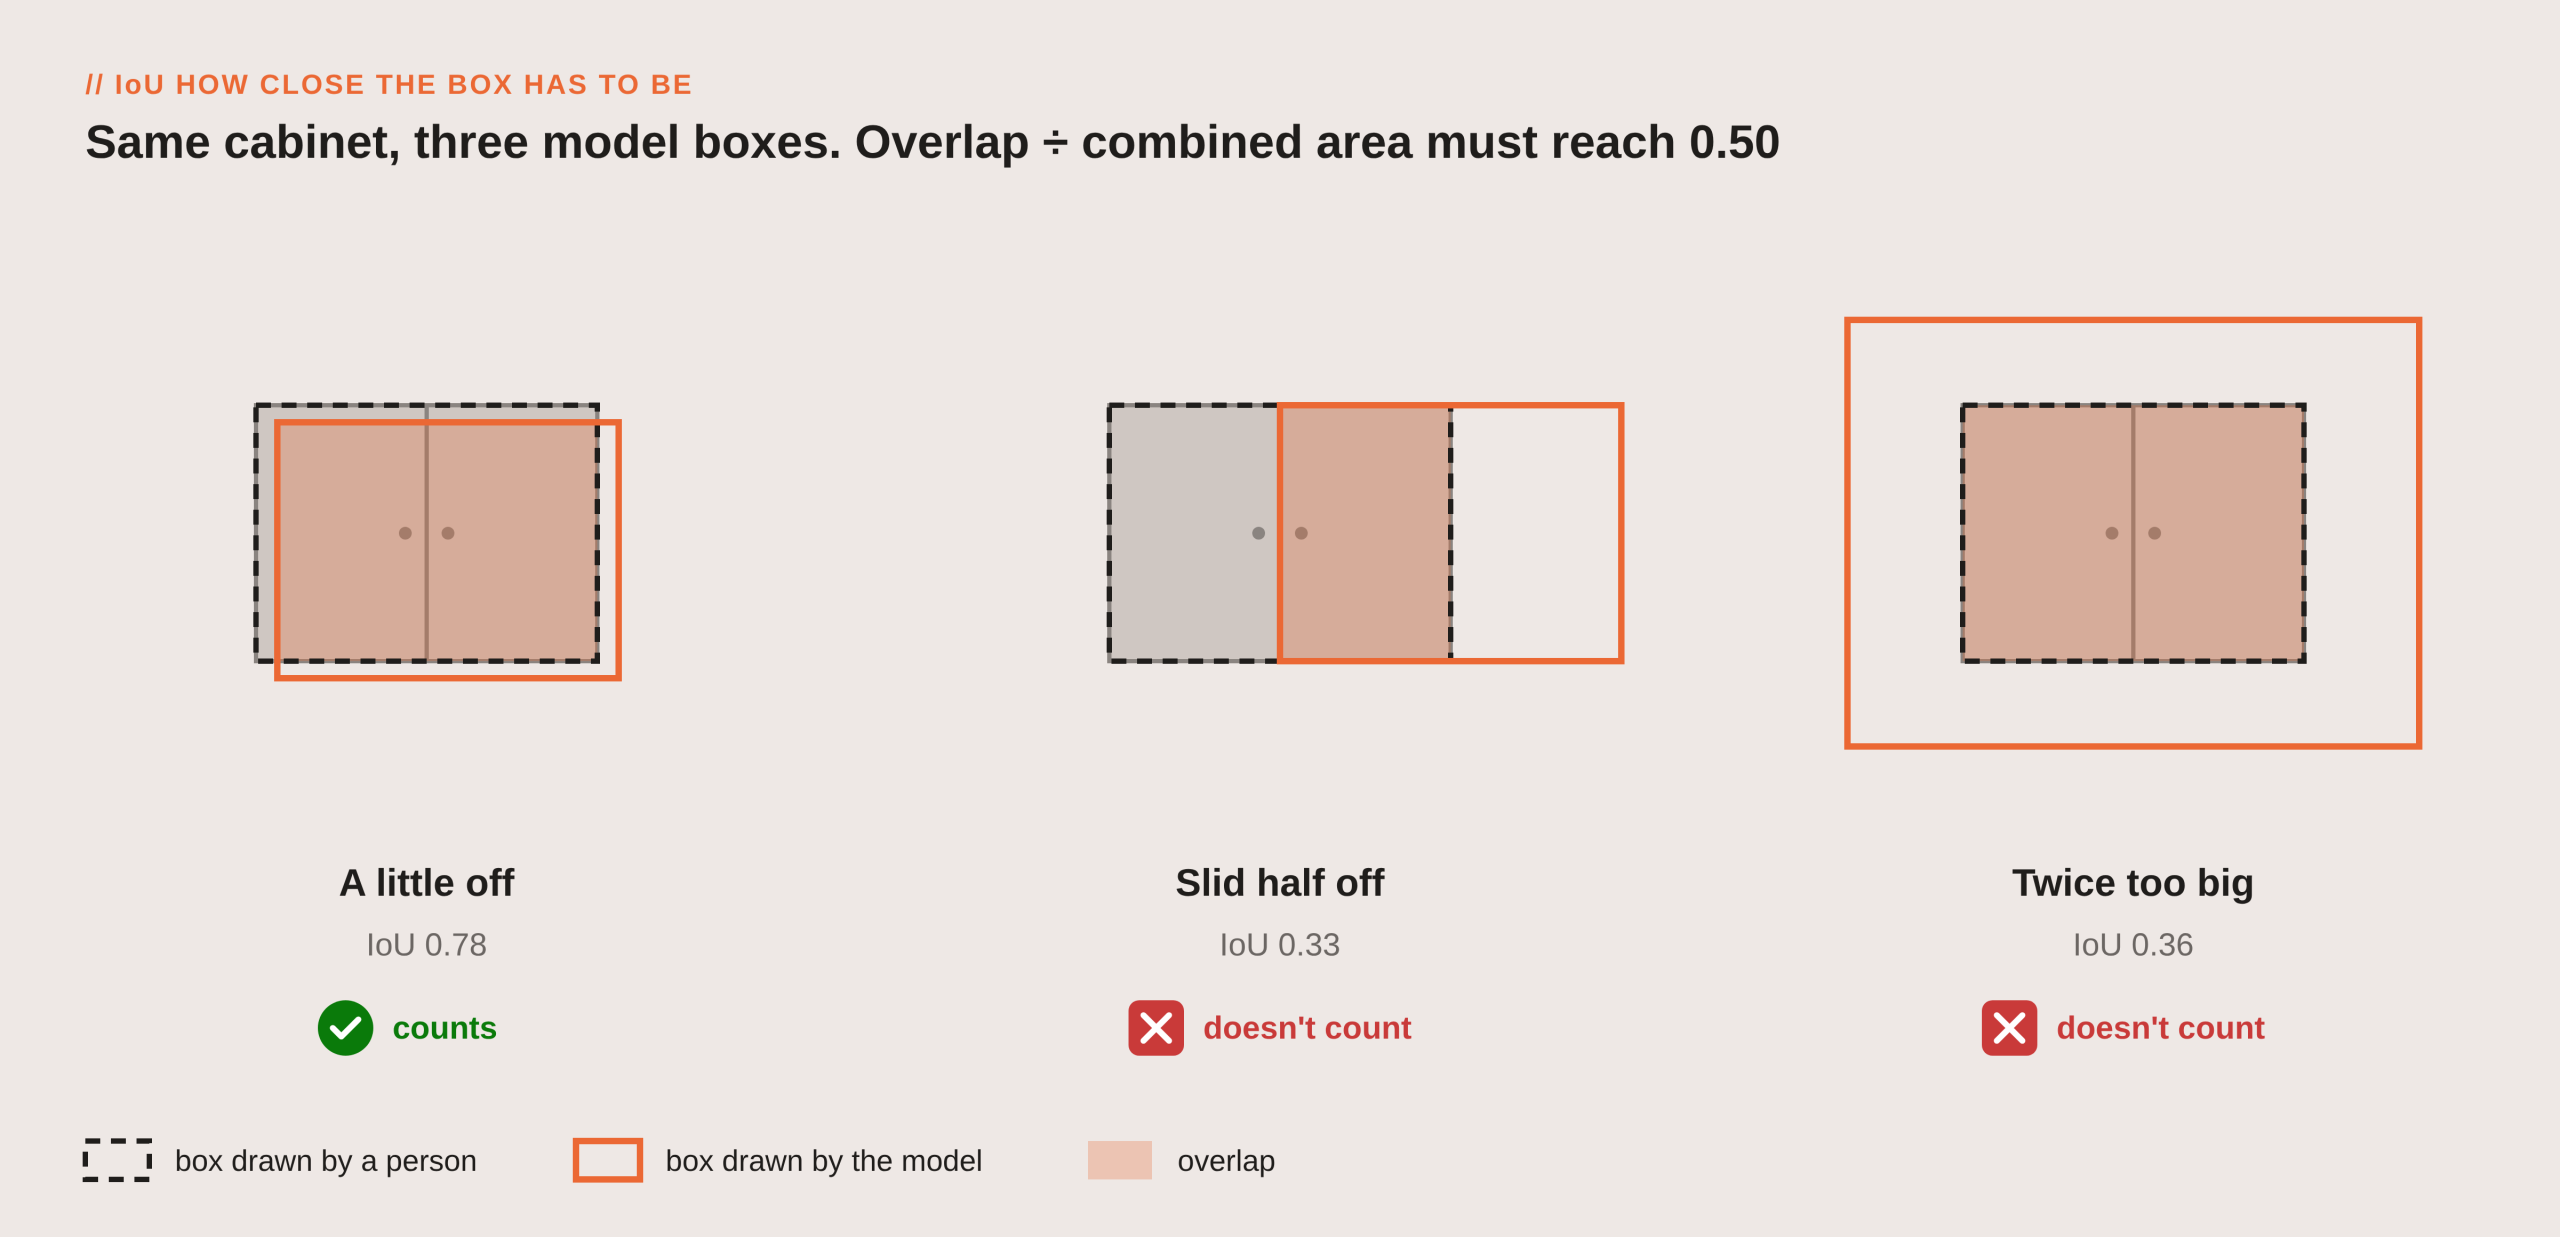
Lay the model’s box and the person’s box on top of each other. IoU is the area they share, divided by the total area the two boxes cover together. Boxes sitting exactly on top of each other score 1; boxes that don’t touch score 0. The name stands for Intersection over Union, which is the maths way of saying overlap over combined area.
CaseVBench counts a prediction as a match when IoU is at least 0.50, so at least half of the combined area has to be shared. A box that is a little off still passes. A box that slid halfway off the cabinet, or one drawn twice too big, does not, even though the model clearly saw the cabinet.
The threshold changes F1 too. The same set of predictions scores higher at IoU 0.20 and lower at 0.70, which is why every F1 in the results says which threshold it was measured at. The primary CaseVBench results use 0.50.
F1 can be very different for different types of objects
The same model can perform well on one type of architectural object and poorly on another.
In the initial CaseVBench results, Qwen3.8-Max scored 98% F1 on floor plans, 90% on elevations, 60% on cabinets, 47% on callouts and 32% on countertops. Its overall F1 was 62%.
Large objects such as floor plans and elevations are easier to locate than small callouts. Countertops can also be difficult because they may appear as thin lines within an elevation rather than as clearly defined shapes.
This is why an overall F1 score needs to be read alongside the object type being measured.
Two models with the same F1 can make different kinds of mistakes
F1 does not show whether a model’s errors mainly come from missed objects or incorrect predictions.
One model might have relatively high precision but lower recall. It finds fewer objects, but most of its predictions are correct.
Another might have higher recall but lower precision. It finds more objects, but also produces more incorrect detections.
The two models could have similar F1 scores while requiring different amounts of human review. That is why precision and recall are useful alongside F1 when comparing models.
An F1 score needs to be interpreted in the context of the task
There is no universal F1 score that defines whether a model is good enough for architectural drawings. The useful level of performance depends on the task, the object type and how the output will be used.
When reading a CaseVBench result, look at F1, precision, recall, IoU threshold and object type together. F1 gives you the combined result, while the other measurements provide the context needed to understand it.