Quick answer: In our August 2026 benchmark of six multimodal AI models across 119 architectural drawing pages and 1,430 hand-labelled objects, Qwen3.8-Max achieved the highest overall F1 score at 62%, followed by Gemini 3.5 Flash at 53%. AI was much better at locating large objects such as floor plans and interior elevations than small or thin objects such as callouts and countertops. In direct full-page processing, current general-purpose AI models are useful for navigating drawing sets and generating starting-point object counts, but their output still requires human verification for estimating work.
These are initial results from August 2026. More models and newer versions will be added as the benchmark grows.
Part 1 recap
In Part 1 we introduced the problem.
Estimators working in casework and millwork spend a significant part of their day finding objects on architectural drawings: cabinets, countertops, interior elevations, and the small callout bubbles that connect one view to another.
Multimodal AI models can now take a drawing page as an image and answer questions about what is on it. We wanted to measure how reliably they can locate specific objects on architectural drawings, and where they break down.
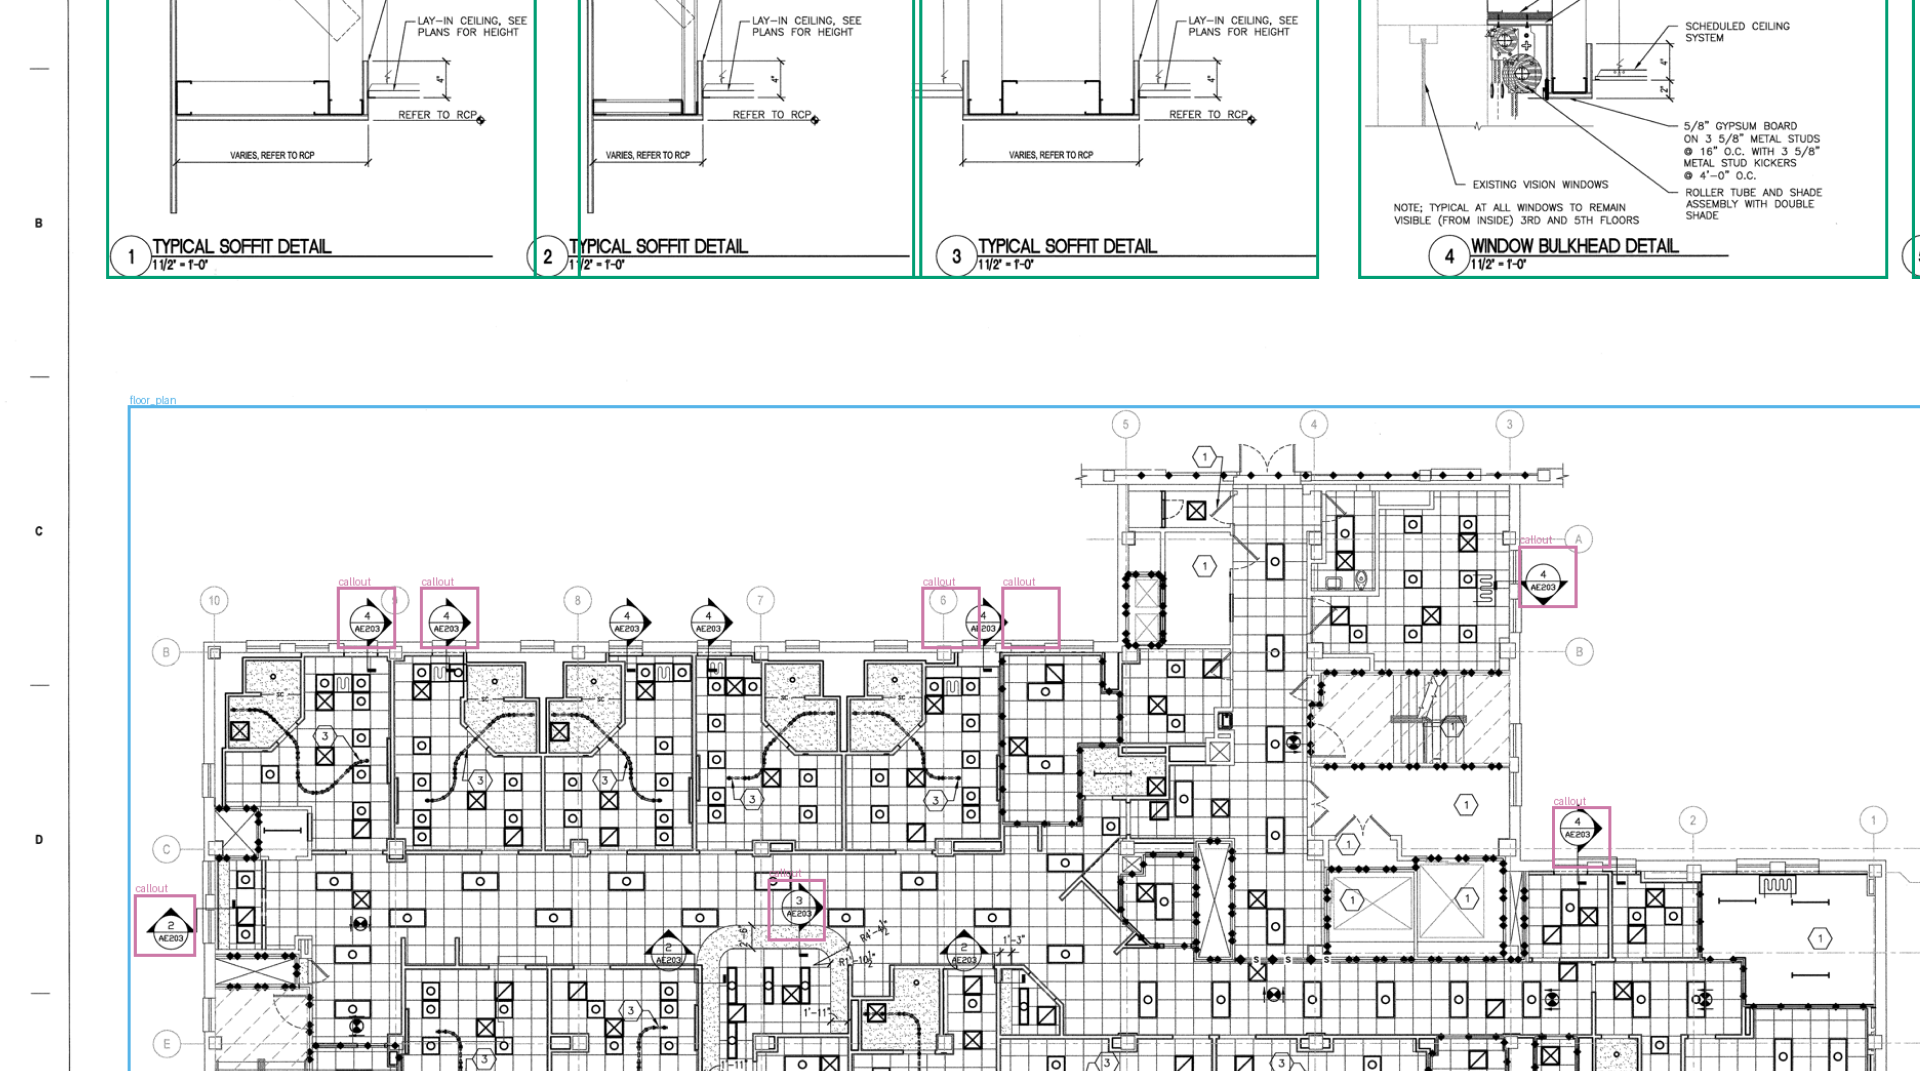
This is harder than it sounds. Architectural drawing pages are dense. When a full sheet is compressed to the resolution accepted by an AI model, a callout can become only a few pixels wide. Object size, image resolution, drawing density, scan quality, and the way the task is posed can all affect the result.
Part 2 focuses on the first of these questions: given the same full architectural drawing page and the same task, how accurately can different AI models locate the same objects?
In this benchmark, “reading” a drawing means locating predefined objects on a page and returning bounding boxes around them. We are not testing whether a model can interpret a whole project or produce a takeoff (more on that in the FAQ below).
The AI architectural drawing benchmark: 119 pages, 1,430 objects, 6 models
We collected drawings from nine publicly available projects, covering 119 pages in total.
The projects come from different offices and different decades of drafting habits, so drawing quality and page density vary. Some pages contain only one labelled object; the busiest pages contain more than 60.
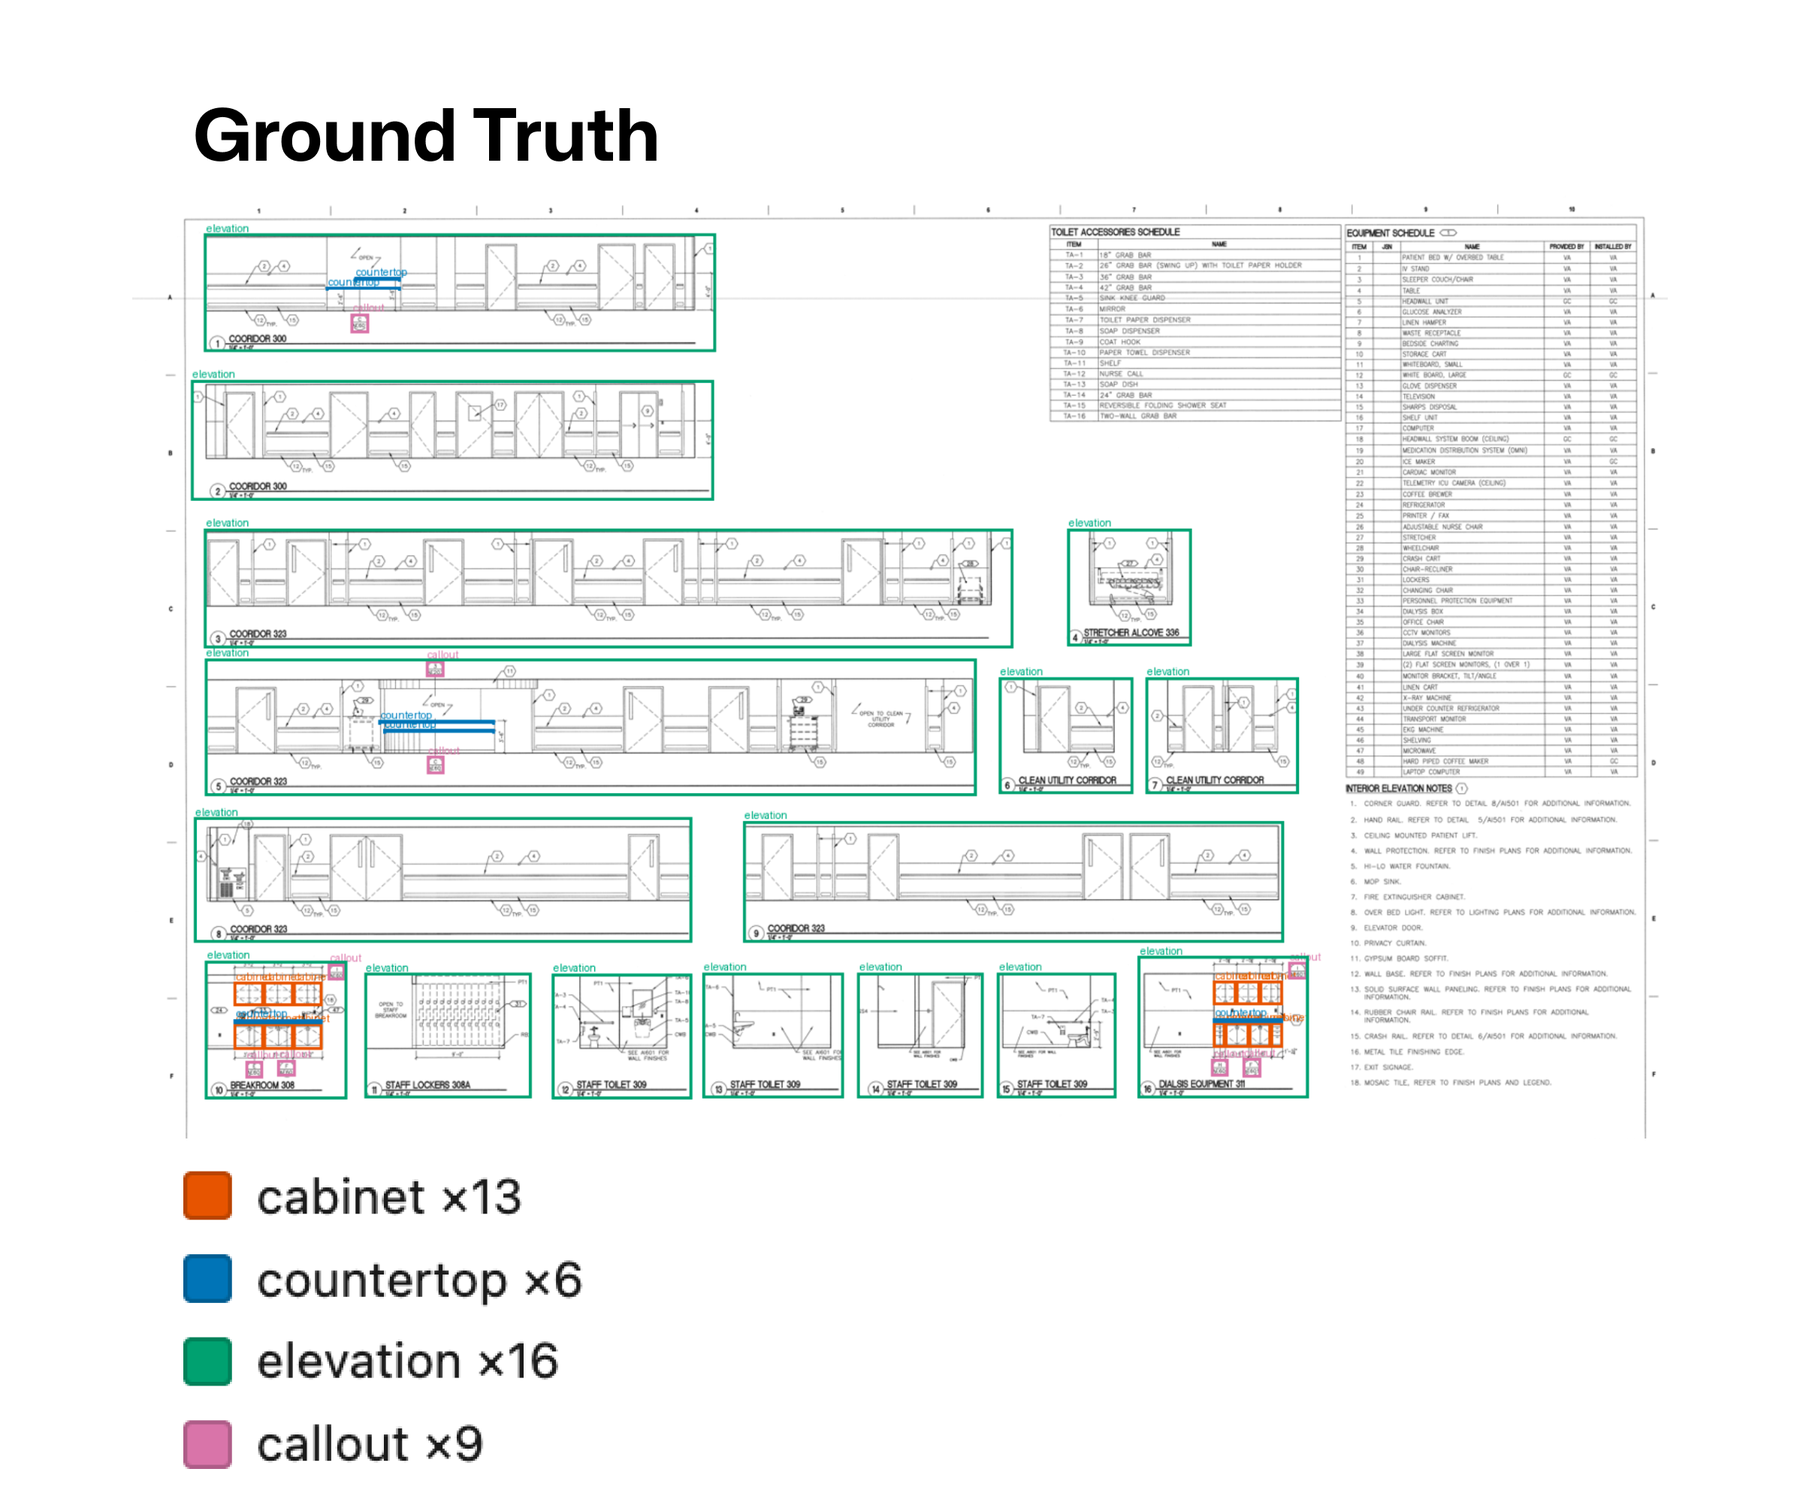
An annotator manually marked every object on every page. The benchmark contains approximately:
- 560 callouts
- 320 cabinets
- 300 elevations
- 170 floor plans
- 90 countertops
That gives us approximately 1,430 hand-labelled objects against which to compare AI output.
Which AI models were tested?
Six multimodal AI models were run on every page using the same direct-mode approach:
- Qwen3.8-Max
- Gemini 3.5 Flash
- Gemini 3.1 Pro Preview
- Claude Opus 5
- Grok 4.6
- Claude Sonnet 5
In direct mode, the complete drawing page is provided to the model and the model returns a list of bounding boxes with coordinates. Other models will be added as the benchmark grows.
How accuracy is scored
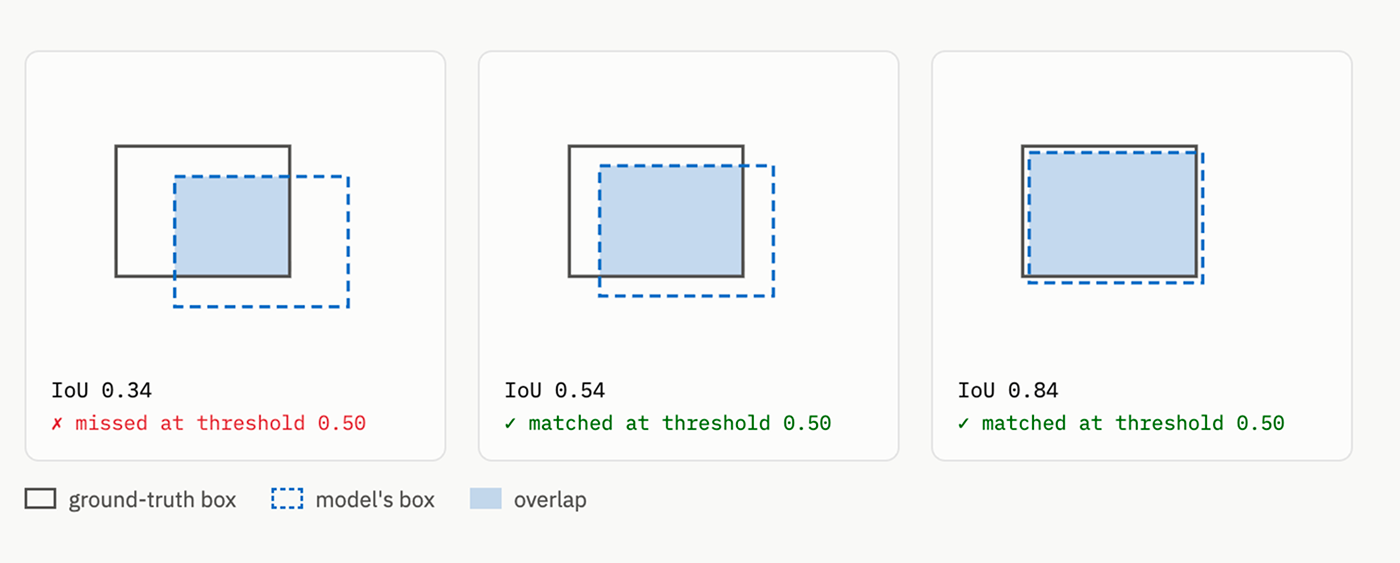
A predicted box counts as correct when it overlaps the human-labelled box by at least half of their combined area (IoU 0.50). From the correct, stray, and missed boxes we calculate an F1 score, which balances objects found against objects invented. A loose box that misses the threshold counts as both a stray prediction and a missed object. The FAQ explains IoU and F1 in more detail.
Which AI model is best at reading architectural drawings?
In this first benchmark, Qwen3.8-Max achieved the highest overall score, with an F1 score of 62%. Gemini 3.5 Flash was second at 53%, followed by Gemini 3.1 Pro Preview at 51%.
However, there is no single model that performs equally well on every type of architectural drawing object.
| AI model | Cabinets | Countertops | Floor plans | Elevations | Callouts | All objects |
|---|---|---|---|---|---|---|
| Qwen3.8-Max | 60% | 32% | 98% | 90% | 47% | 62% |
| Gemini 3.5 Flash | 45% | 16% | 96% | 90% | 33% | 53% |
| Gemini 3.1 Pro Preview | 39% | 10% | 89% | 78% | 37% | 51% |
| Claude Opus 5 | 51% | 19% | 96% | 89% | 15% | 40% |
| Grok 4.6 | 5% | 7% | 91% | 69% | 0% | 30% |
| Claude Sonnet 5 | 10% | 0% | 73% | 47% | 4% | 21% |
The model ranking is less informative than the difference between object types. The same AI model can be very good at finding a floor plan and very poor at finding a countertop on the same type of drawing.
That means there is no meaningful answer to “How accurate is AI at reading architectural drawings?” without also asking: accurate at finding what?
How accurate is AI at finding different objects on architectural drawings?
Floor plans: AI performs very well
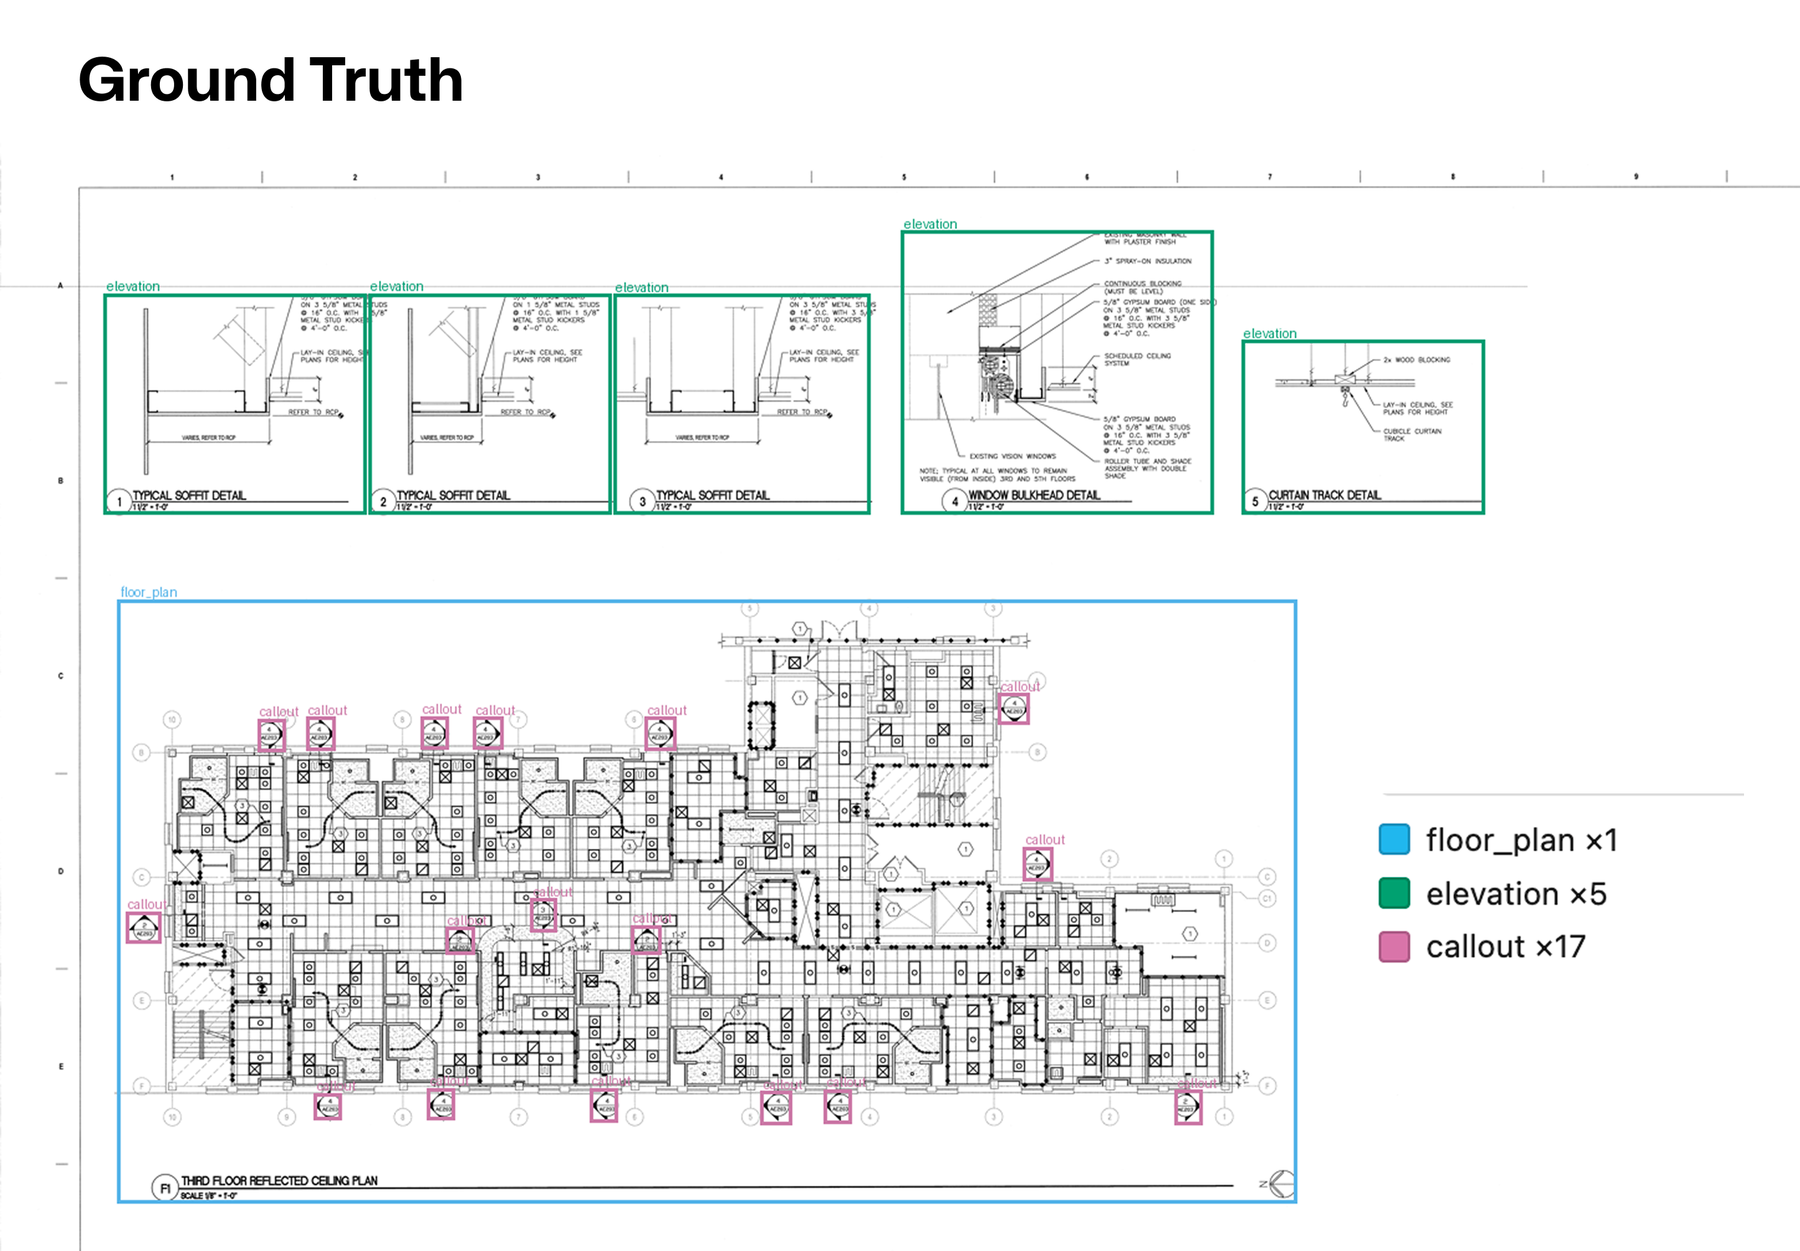
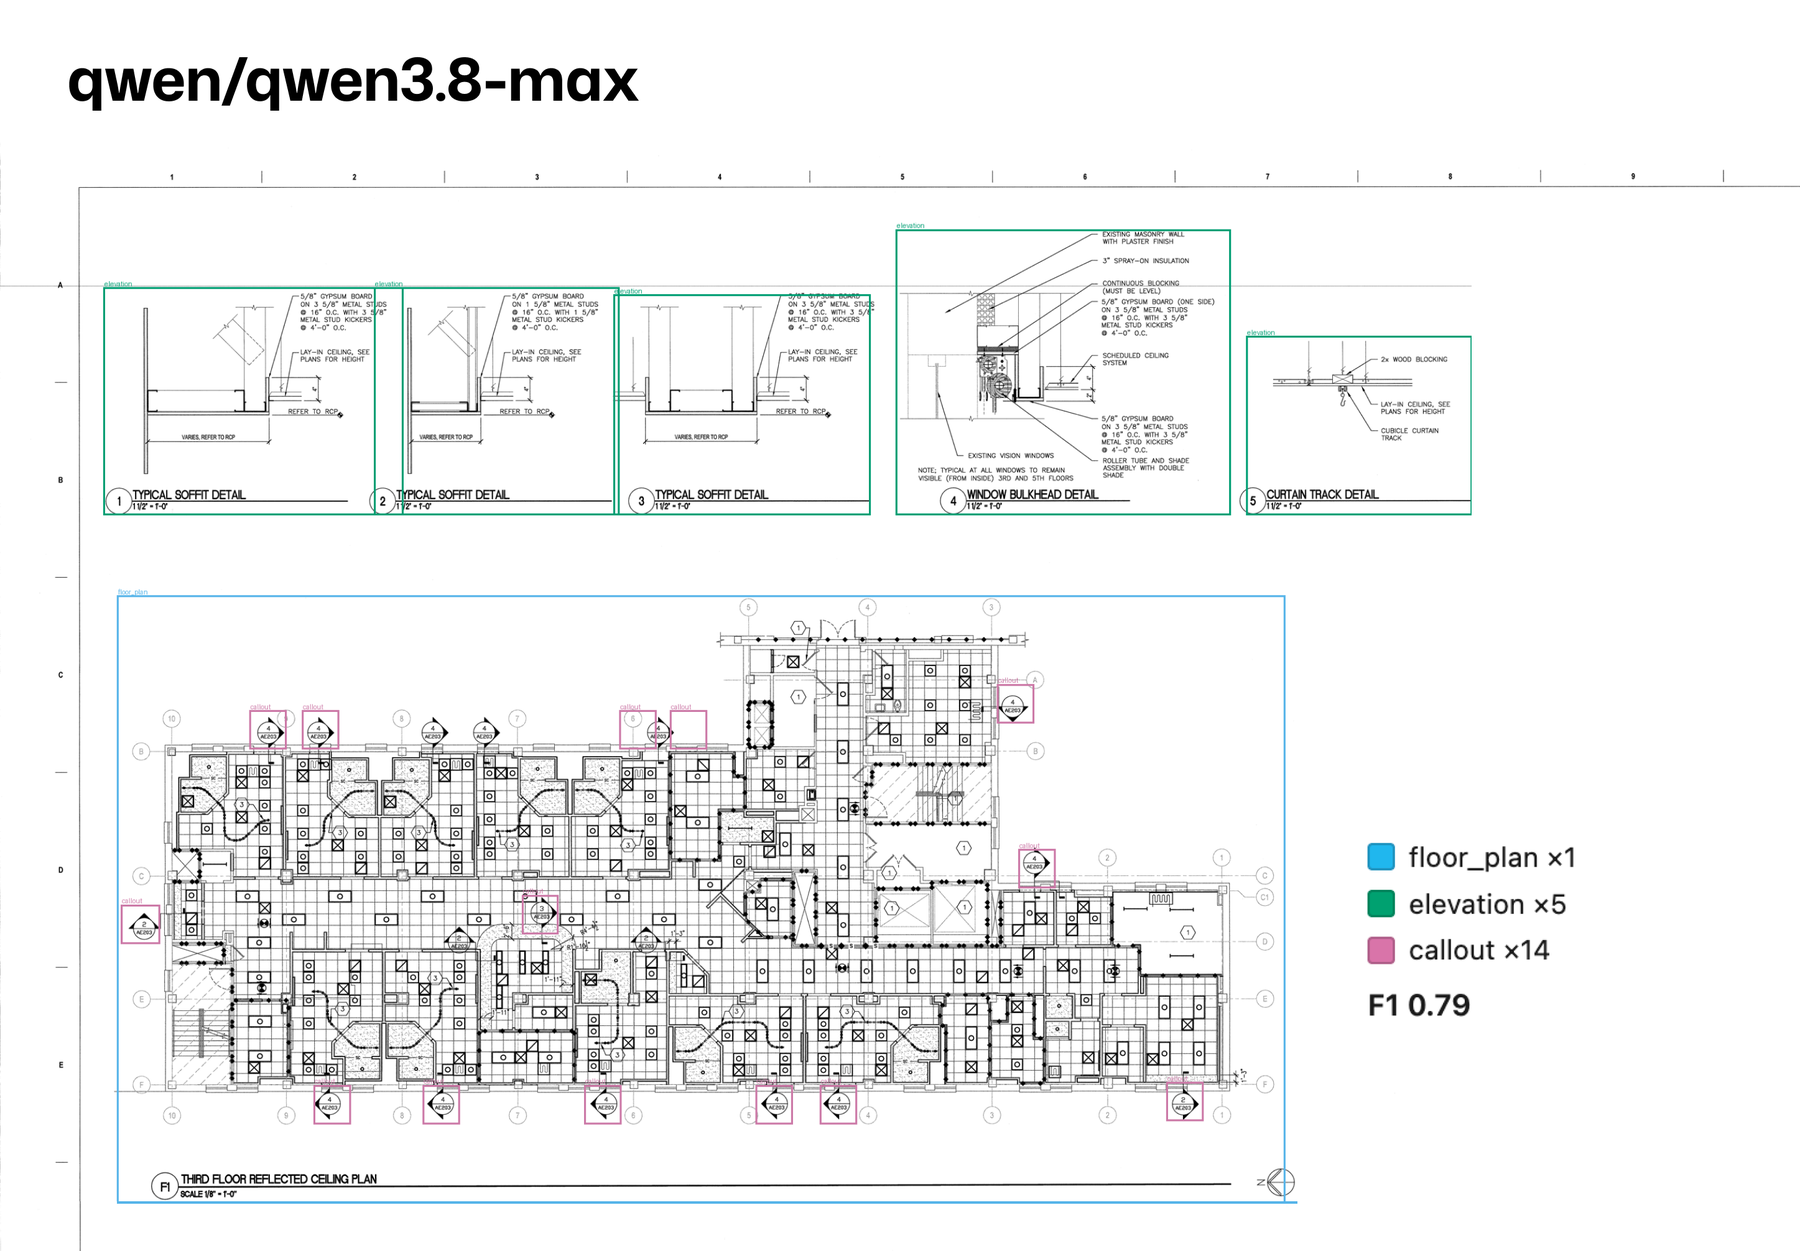
Floor plans are the easiest object category in this benchmark. The best result was 98% F1 from Qwen3.8-Max, and every model except Claude Sonnet 5 scored at least 89%.
Floor plans are relatively large visual objects and often occupy a substantial portion of a drawing sheet. Their size makes them easier for a multimodal model to identify than small symbols or thin lines.
Interior elevations: AI also performs well
Interior elevations are the second-strongest category. The best models reached 90% F1, and three of the six scored 89% or higher.
Like floor plans, elevations are relatively large views, often occupying a quarter of a page or more. Their visual scale gives the AI model considerably more information to work with than a tiny callout or thin countertop line.
Cabinets: AI is usable, but not reliable enough to skip checking
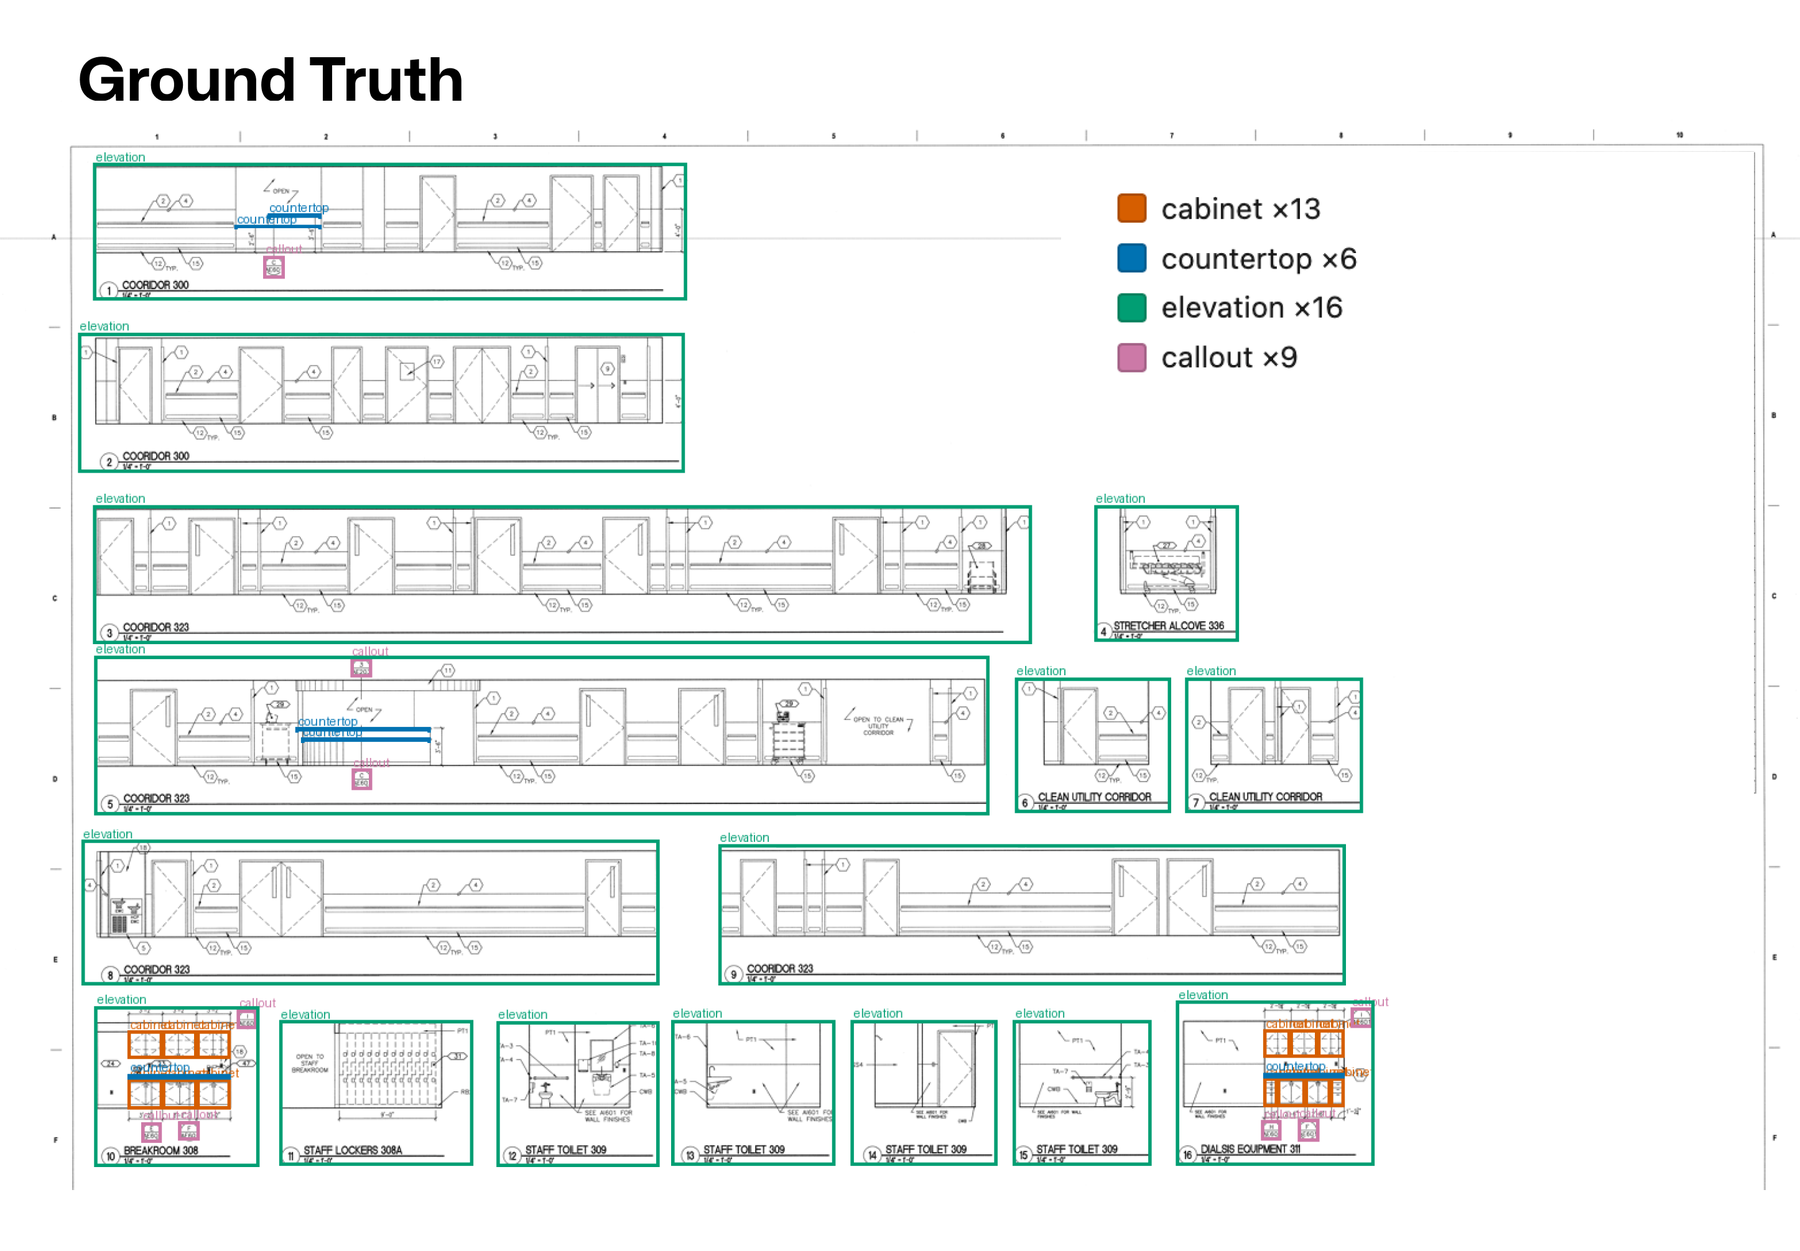
Cabinets are smaller objects embedded within elevations and other views. The strongest cabinet result was 60% F1 from Qwen3.8-Max; the top four models scored between 39% and 60%.
For estimating workflows, cabinet detection can provide a useful starting point, but the benchmark does not support treating raw AI output as a final cabinet count without verification.
Callouts: AI struggles with small symbols
Callouts are small circles containing numbers or other identifiers. The models performed very differently here. Qwen3.8-Max achieved 47%, while Gemini 3.1 Pro Preview and Gemini 3.5 Flash achieved 37% and 33%. Other models performed poorly. Grok 4.6 returned 317 callout boxes across the dataset, but only two matched the human-labelled callouts at the 0.50 IoU threshold.
The problem is partly geometric. A callout may be only a few pixels across in a full-page image, so a small positional error makes a large difference to its IoU score.
Countertops: the hardest category
Countertops produced the lowest scores. The best result was only 32% F1 from Qwen3.8-Max.
Countertops are not necessarily the smallest objects on a sheet. The problem is their visual representation. On an elevation, a countertop can appear as a thin horizontal line sitting above a cabinet run. Unlike a cabinet, it may not have a clear enclosing shape that an AI model can use to determine the object’s boundaries.
No model scored above one third on countertops, and Claude Sonnet 5 found none at the primary IoU threshold.
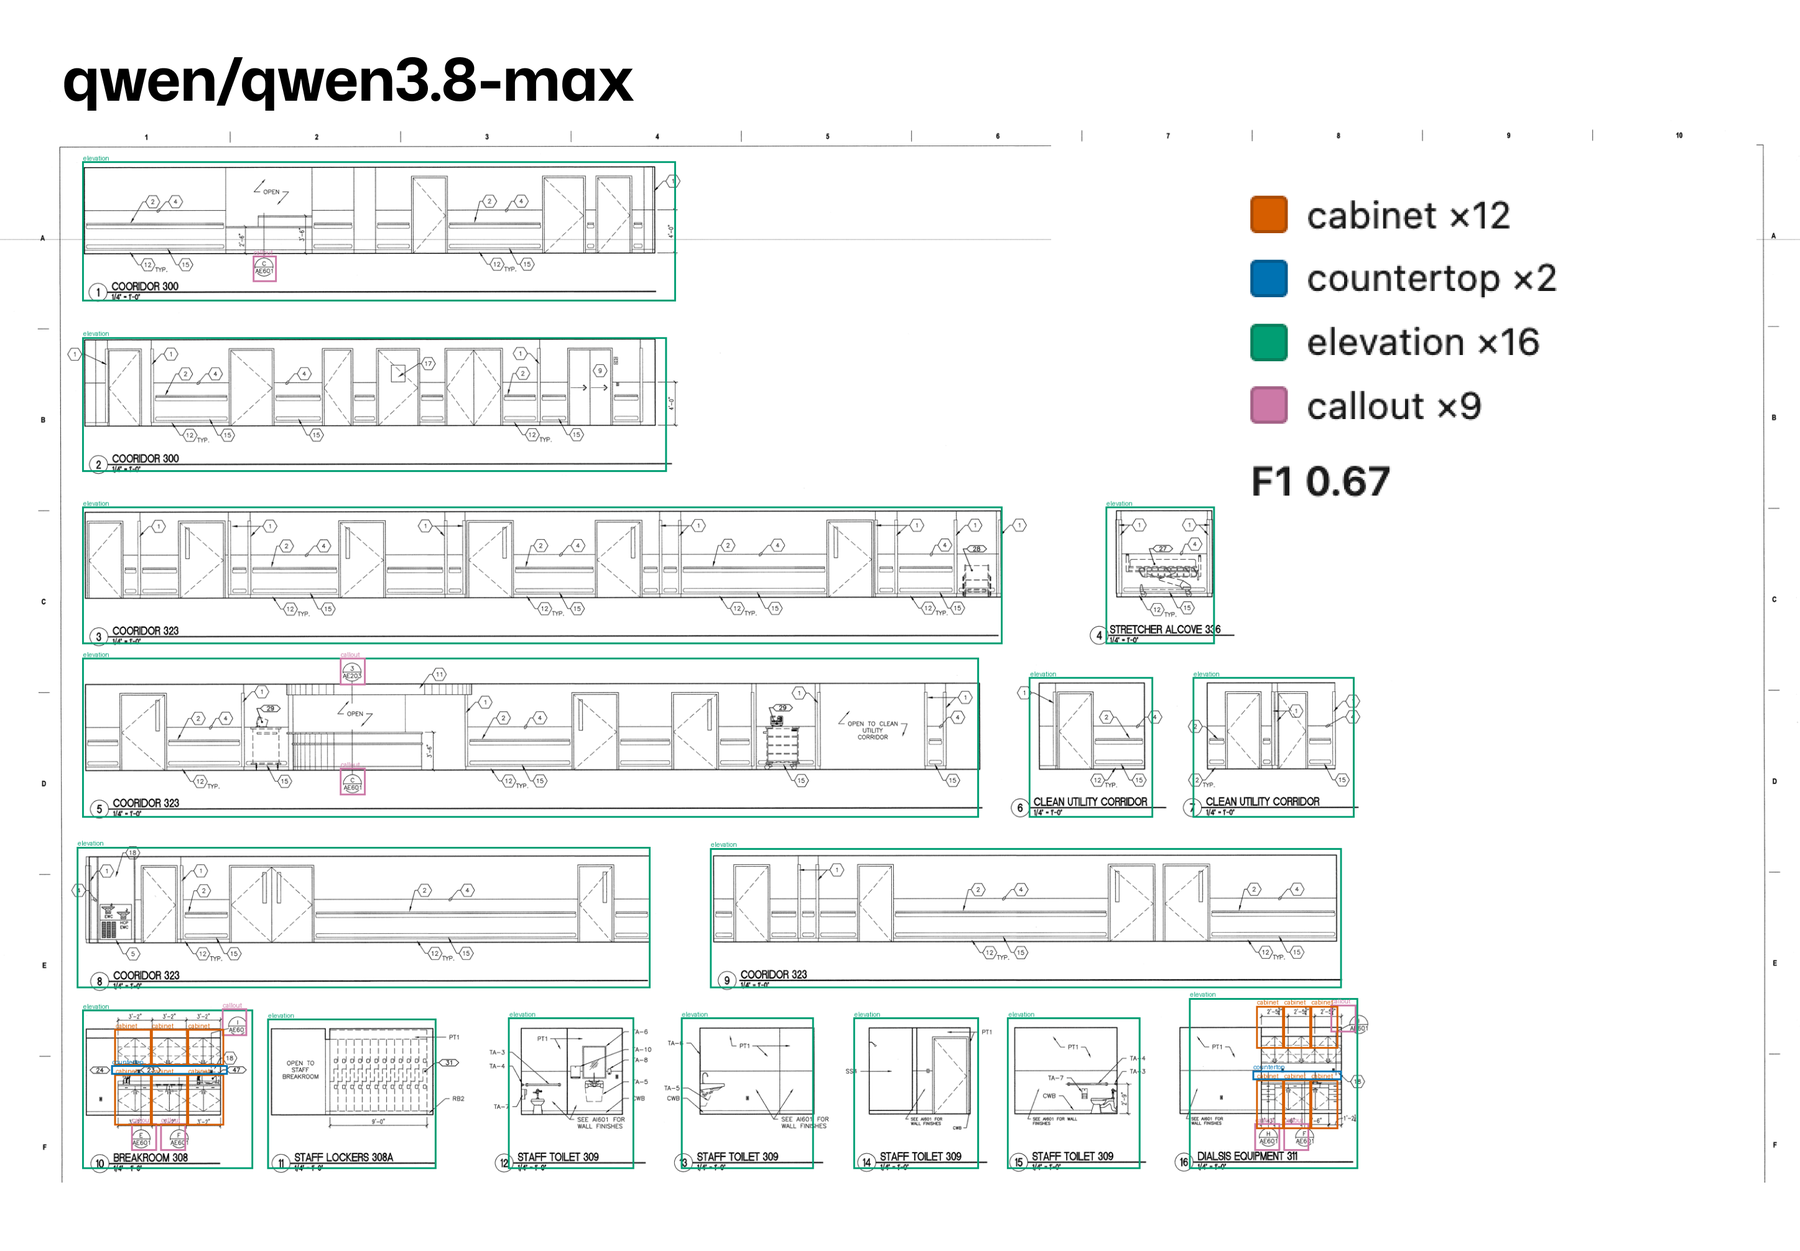
Object size predicts AI accuracy better than model choice
For every model, the broad pattern is similar: floor plans, then elevations, then cabinets, then callouts, then countertops.
The best model scores 98% on floor plans but only 32% on countertops. That is a 66-point difference within one model. By comparison, the gap between the best and worst model is much smaller for several individual object categories.
This suggests that improving the way an architectural drawing is presented to a multimodal AI model may be at least as important as switching between models.
AI models can count objects better than they can locate them
Gemini 3.5 Flash returned 314 cabinet boxes across the dataset. The human markup contains 317 cabinets. At first glance, that sounds extremely accurate. But the cabinet F1 score is only 45%.
Knowing that there are approximately 317 cabinets is different from drawing a sufficiently accurate bounding box around each individual cabinet. Gemini Flash’s project-level cabinet counts were off by 17% on average, but many of its boxes were shifted or oversized and therefore failed the IoU 0.50 requirement.
What happens if we relax the localization requirement?
At an IoU threshold of 0.20 instead of 0.50:
- Gemini 3.5 Flash increases from 53% to 76% overall
- Claude Opus 5 increases from 40% to 59%
- Claude Sonnet 5 increases from 21% to 42%
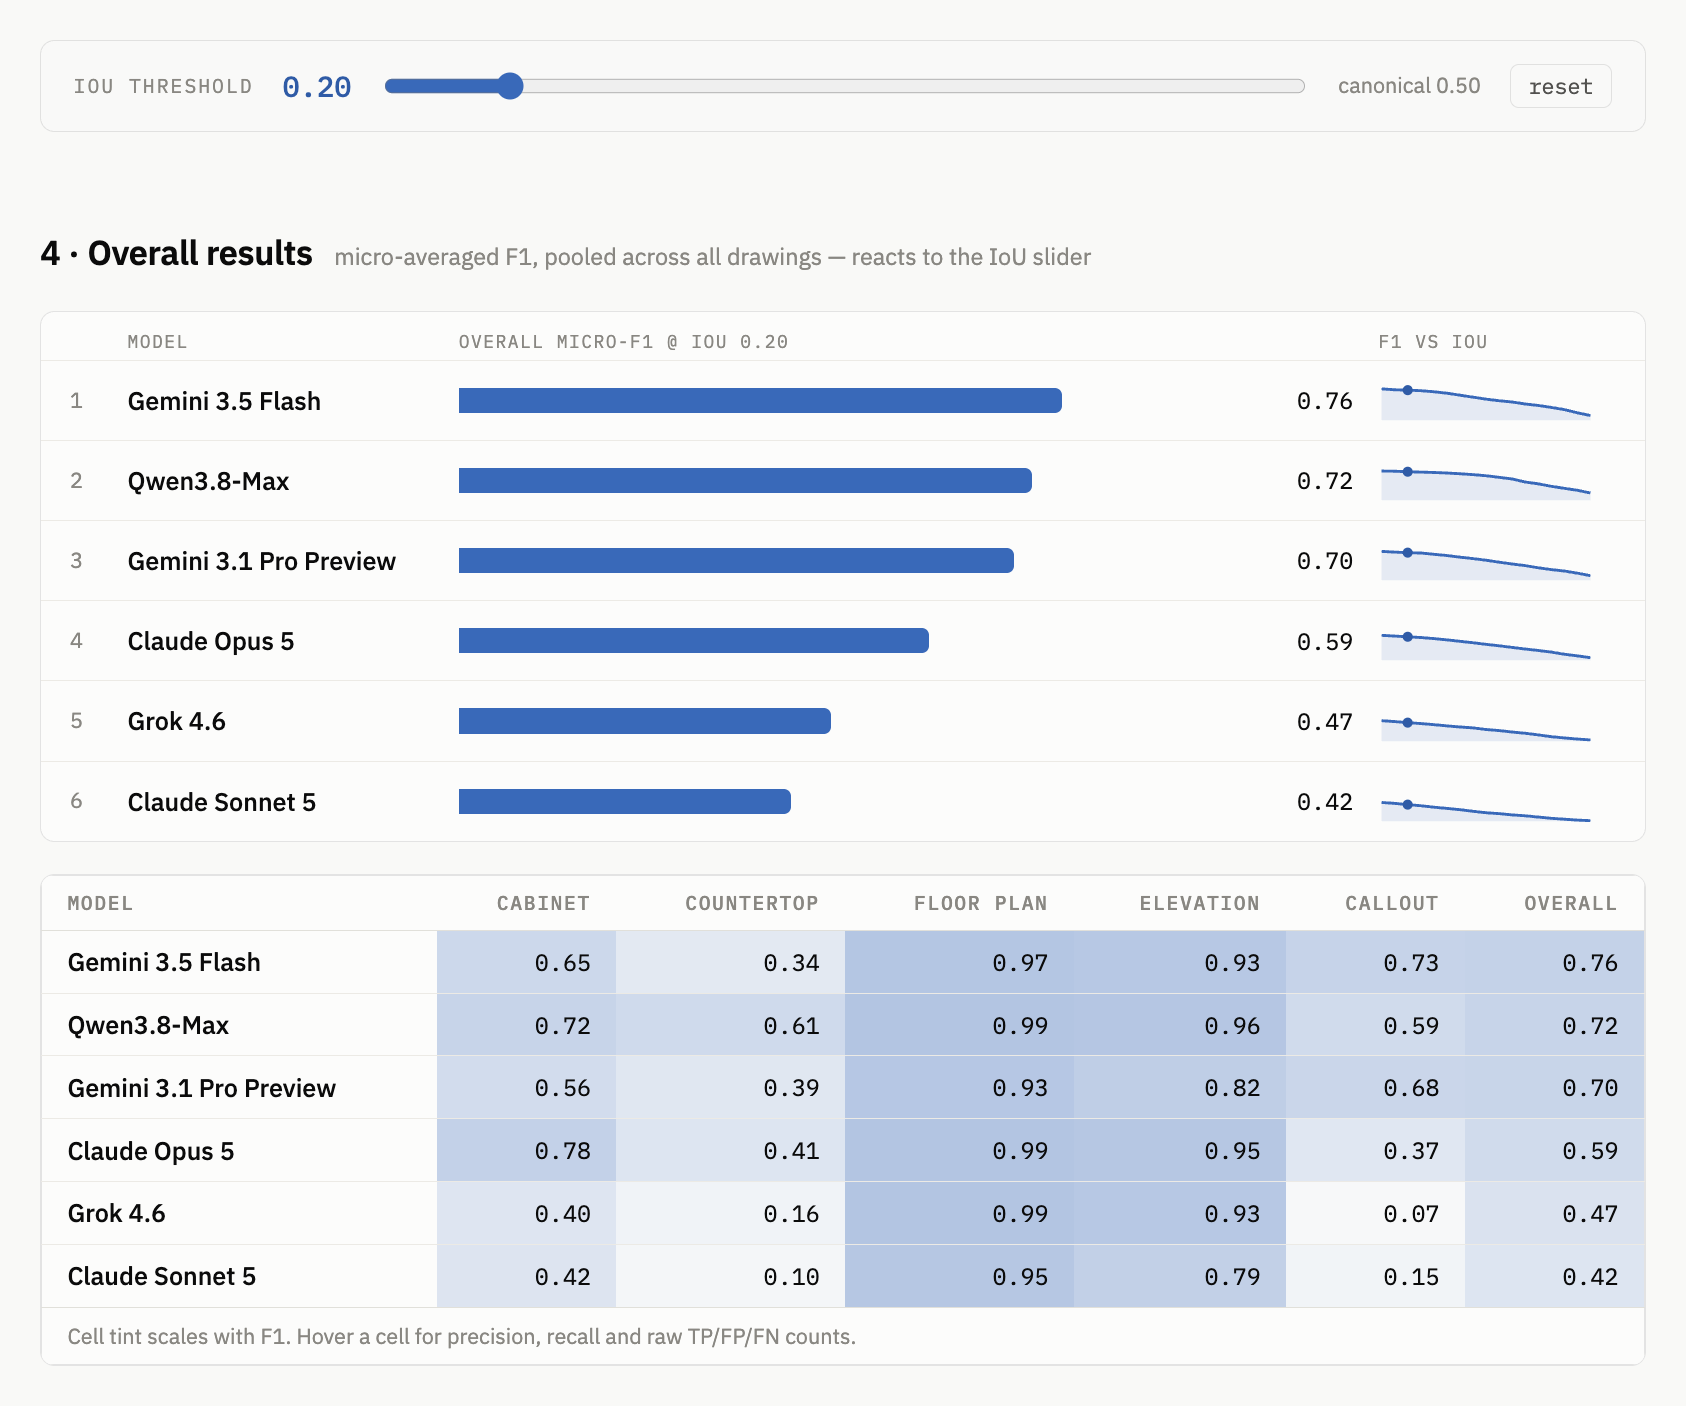
Callouts show the largest improvement. Their small size means that even a few pixels of positional drift can substantially reduce IoU.
This distinction matters for AI-assisted estimating. If the task is “How many cabinets are on this page?”, the models may be more useful than the headline F1 score suggests. If the task is “Show me exactly where every cabinet is so an estimator can trust the result without checking the sheet”, the current results are much weaker.
We use IoU 0.50 as our primary benchmark because a loose bounding box has limited practical value when a person must verify the result on the drawing.
How do different AI models fail on architectural drawings?
The overall F1 score hides an important difference: models can fail by missing objects or by inventing objects. Those failures create different amounts of work for a human estimator.
Claude Opus tends to over-detect
Across the dataset, Claude Opus produced 1,405 callout boxes for 557 actual callouts. At a lower overlap threshold, it covers approximately three quarters of the true callouts, but only around one in ten of its predicted boxes is a callout. The remaining predictions include other circles, tags, and bubbles on the sheet. For a human reviewer, an Opus-style result can require significant cleanup.
Gemini Pro tends to skip objects
Gemini 3.1 Pro Preview has a different failure pattern. On elevations, when it draws a box, it is right 94% of the time, but it only draws boxes for 67% of the elevations that exist. The output is relatively precise but incomplete. For an estimator, the work is going back to the drawing to find what the AI missed.
Grok misses many objects
Grok 4.6 finds only 26% of all objects in this benchmark. Its performance is particularly weak on callouts, cabinets and countertops.
Qwen finds more, at the cost of extra boxes
Qwen3.8-Max finds approximately 71% of objects at 55% precision. It sees more of the drawing than the other models, but it also generates more boxes that require checking.
Two AI models can have similar headline accuracy but create very different workloads for an estimator. One model might produce “Here are 20 objects. I am confident about most of them.” Another might produce “Here are 40 possible objects. You need to delete the wrong ones.” The best model for an estimating workflow therefore depends on F1 and on how the model’s errors affect human review time.
Drawing complexity matters as much as the AI model
AI accuracy also changes substantially from project to project. Qwen3.8-Max ranges from 44% on the densest project to 88% on two lighter projects. Gemini 3.5 Flash ranges from 26% to 85%.
The densest project contains 323 objects and 103 elevations. Every model performs worst on that project. Conversely, every model performs well on the project containing only floor plans and elevations.
An AI model’s benchmark score should not be interpreted as a universal accuracy number. A model’s performance depends on the drawing set, object types, page density, image quality and task definition.
What is the fastest and cheapest AI model for architectural drawings?
We also measured model response time and cost per page over the 119-page run.
| AI model | Cost per page | Time per page |
|---|---|---|
| Gemini 3.5 Flash | $0.035 | 20 s |
| Gemini 3.1 Pro Preview | $0.040 | 23 s |
| Qwen3.8-Max | $0.057 | 161 s |
| Claude Sonnet 5 | $0.073 | 60 s |
| Claude Opus 5 | $0.134 | 48 s |
| Grok 4.6 | $0.145 | 362 s |
Cost varies by a factor of approximately four, from $0.035 to $0.145 per page. Response time varies by a factor of approximately eighteen.
The two most expensive models, Grok and Opus, rank fourth and fifth in overall accuracy. Qwen3.8-Max, the highest-scoring model, sits in the middle on cost but is the second slowest at approximately 2.7 minutes per page.
For a 100-page drawing set, that means approximately:
- Gemini: $3–4
- Qwen: $6
- Opus or Grok: $13–14
Qwen’s processing time also adds up: approximately four and a half hours for 100 pages when pages are run one after another.
Gemini 3.5 Flash is an interesting alternative if cost and speed matter more than the highest benchmark score. It scores 53% overall versus Qwen’s 62%.
The bottom line
The first run gives a fairly clear picture of where multimodal AI stands on architectural drawings in August 2026.
Qwen3.8-Max is the strongest overall model in this benchmark at 62% F1. But object type matters more than model choice. AI performs very well on large visual objects such as floor plans and elevations. Performance falls significantly for cabinets and becomes poor for small callouts and thin countertops.
The models also show a distinction between counting an object and locating it precisely. A model can produce a cabinet count that is close to the human count while still failing to place sufficiently accurate boxes around individual cabinets.
And the drawing itself matters. Dense pages reduce performance across models.
For an estimator, the current practical use of general-purpose multimodal AI is closer to “use AI to navigate the drawing set, identify relevant views, and create a starting point that a human estimator verifies” than to “upload the drawing set and let AI do the entire takeoff”. That is already useful, and it is a different thing from autonomous estimating. It is also the gap a purpose-built system closes: at the largest U.S. casework factory, that work went from six hours to ten minutes.
What comes next: structured processing
Everything measured above uses a simple workflow: one full drawing page in, one answer out. Part 1 described a second approach, structured processing, where the task is broken into steps:
- Find the interior elevations.
- Crop the relevant elevation.
- Analyze the cropped elevation at higher effective resolution.
- Identify the cabinets, countertops and other objects inside it.
Our early runs using this approach perform substantially better than the direct full-page results reported here. The likely reason is resolution: a cropped elevation can reach the model at several times the effective resolution of the same elevation embedded in a complete sheet.
We will publish those results once the structured-processing benchmark has been verified across the full dataset. The dataset is also growing, and models will be re-run as new versions become available. If you want the method behind the scoring rather than the results, our LLM evaluation work covers how these ground-truth datasets and automated runs are built.